Barack Obama’s job – and yours
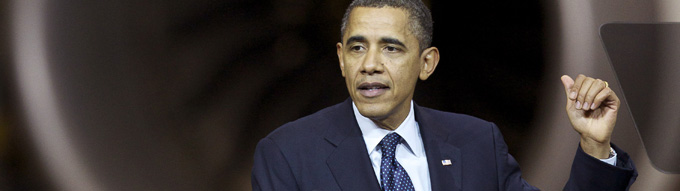
Can Barack Obama win re-election with the current employment rate?

Published On 22 Feb 2012
This is the first in a two-part article about unemployment and the 2012 presidential candidates’ plans to create jobs. The first part, below, analyses the relationship between unemployment rates and presidential elections, and takes a close look at Obama’s jobs plan. The second part will examine Mitt Romney’s and Rick Santorum’s jobs plans.
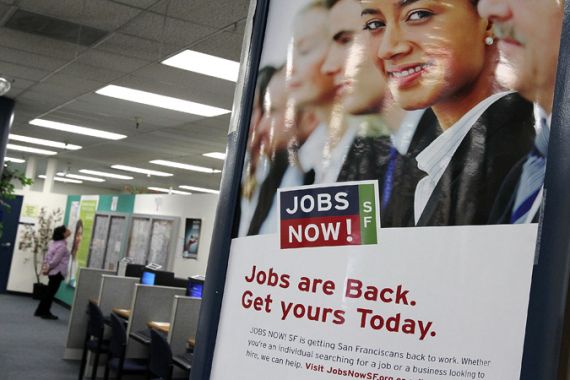
San Pedro, CA – “No president since World War II has been re-elected with an unemployment rate over 7.2 per cent.” That’s a snippet of conventional wisdom that’s been floating around almost since the day that Barack Obama was inaugurated in January 2009, a month that ultimately closed out with an ominous unemployment rate of 7.8 per cent – although it was only reported at 7.6 per cent at the time.
Keep reading
list of 4 itemsWhy is Biden ratcheting up the trade war with China?
Ivorian cocoa farmers ‘barely survive’ while chocolate company profits soar
Singapore Airlines death: Is climate change making air turbulence worse?
That too-rosy, though still dismal employment statistic was just one factor feeding into a too-rosy economic projection that ended up getting the Obama Administration into a good deal of trouble. Although economic adviser Christine Romer originally pushed for a $1.8tn stimulus in a December 2008 memo, that was considered politically impossible, and Obama officially asked for less than half that amount – and still was greeted with intense GOP opposition, even though around 40 per cent of his stimulus package was tax cuts. The projections released on January 10, 10 days before his inauguration, anticipated peak unemployment of 8 per cent with the scaled-down stimulus, and 9 per cent without it. In reality, the 8 per cent figure was passed the next month, which ended with at 8.3 per cent unemployment. The stimulus plan was signed into law on February 18.
On the surface, Republicans were able to argue the stimulus was a failure, since unemployment peaked at 10 per cent in October 2009. But Romer’s original calculations had been generally vindicated: the recession was far more severe than originally anticipated, and a much larger stimulus had been called for. The unemployment rate could have easily been over 11 per cent or more without the stimulus. That’s scant solace, of course. But those stubbornly high unemployment rates may not be as politically deadly as they once seemed.
For one thing, they are finally coming back down to earth – though still nowhere near what they should be. Yet, at 8.3 per cent – down 0.7 per cent in four months – the unemployment rate now matches that of February 2009. It’s still a far cry from 7.2 per cent, but that level nine months from now is far from impossible.
More importantly, though, that 7.2 per cent figure extremely misleading, as Nate Silver explained at the New YorkTimes “
“538” blog last June. For one thing, Ronald Reagan was re-elected with a 7.2 per cent unemployment rate – by a whole 18 points – strongly suggesting he could have been re-elected with a much higher rate than that. (What’s more, before World War II FDR was re-elected by even bigger landslides in 1936 and 1940, with unemployment still in double digits!)
But the real problem Silver highlighted was an overall lack of correlation. “Historically, the correlation between the unemployment rate and a president’s electoral performance has been essentially zero.” And, of course, he had the charts to prove it. He also said that looking at the change in the unemployment rate over a president’s term was little better. “This does produce some positive correlation, but it’s quite weak and almost entirely driven by a couple of outlying data points surrounding the Great Depression.” Again, he had the charts to prove it.
|
Obama sets out tax raises for rich in budget |
There’s just one catch: the four-year time-frame wasn’t a good predictor, but a two-year time-frame could work wonders, as an AP story from last month pointed out. “Going back to 1956 no incumbent president has lost when unemployment fell over the two years leading up to the election. And none has won when it rose.” True enough, but still misleading, George Washington University political scientist John Sides told me.
Sides has published on the subject of economically modeling elections, as well as writing about it on the blog Monkey Cage, which he co-curates. First off, “the year before is what matters more”, rather than the two-year period, he said. Second, “It’s not necessarily useful to pick any one indicator or one particular threshold that candidates need to meet. It’s the general trend that matters.”
There are, in fact, a number of strong indicators to choose from, if you look at election year changes. “We shouldn’t get too concerned with which exact indicator we choose. When the economy is growing, most indicators will move in a positive direction: GDP, real disposable income and unemployment. That’s the important point.”
In a paper Sides coauthored, he noted that “at a meeting of political scientists held over Labor Day weekend in 2008 – even before the start of the Republican National convention – a panel of political scientists each presented a forecast of the outcome. Almost all of them predicted the exact outcome within a couple of percentage points. The average of their predictions was 53 per cent, and that’s what Obama got.” So much for all the hoopla over Sarah Palin – at least for that election. And indeed, the nine-month period from January through September seems quite enough for predictive purposes. By the time the traditional campaign season is halfway done, the economic cake is already baked.
Although Silver missed these nuances initially, he caught up rather thoroughly, writing another post last November, in which he looked at 43 economic variables over the nine-month period for the 16 presidential elections held since World War II. The strongest indicators all account for a third of the winning margin or more. These were real GDP, real personal income, change in nonfarm payrolls, change in unemployment rate, change in employment-to-population ratio and the ISM manufacturing index, a multi-factor index regarded as a leading indicator for the economy at large. Not too surprisingly, this leading indicator proved the strongest election predictor, accounting for 46 per cent of winning margin. Altogether, Silver found 21 economic indicators that accounted for at least one-fifth of the winning margin.
Summing up, what all the above tells us is:
- The unemployment rate is electorally unimportant. From a human standpoint, as well as an economic one, it’s very bad indeed that the unemployment rate still stands at 8.3 per cent, with many millions more who are working part-time involuntarily, or else have left the job market entirely. But from a political standpoint, this is irrelevant.
- The change in unemployment rate from January to September this year is very important,but so are a handful of other economic indicators. As the economy continues to improve, the unemployment rate may go up again temporarily, as previously discouraged workers rejoin the potential workforce pool. But as long as the overall trend is positive, and other indicators continue moving in the same direction, Obama could be in very good shape, even if the unemployment rate remains higher than 7.2 per cent. What matters, in short, is whether or not people feel the economy is improving fast enough to promise a better tomorrow, and make them reluctant to take chances on switching direction.
- Most political commentators are woefully ignorant about how the economy impacts elections. Conventional wisdom – even when it’s good enough to be technically true – can be dangerously shallow and misleading. An example comes from a Monkey Cage post by Sides from June 2010, “Do Americans Really Want to Cut the Deficit?” As Sides shows, reducing the debt has a much smaller effect on the incumbent party’s presidential candidate’s share of the vote than does increasing Americans’ disposable income. (Both measures are for the single year before the election.) The lesson about conventional commentators’ ignorance applies in other ways as well, such as evaluating the candidates’ job proposals, to which we now turn. It’s not that everyone is stupid – they’re not. But crucial big-picture facts may be missing from the pictures they paint. And with all the Republican candidates in particular offering “jobs” plans that actually encompass every aspect of economic policy and then some, it’s increasingly necessary to compare overall visions of how the economy works and how it can be made to function better.
Obama’s jobs plan
In September 2011, Obama announced a four-part, $447bn jobs plan (with a fifth part dedicated to making sure it would be deficit-neutral), which Republicans in Congress blocked. But it remains a good guide to the kinds of things he would like to do in a second term. Parts of it are about to be passed, as shifting political fortunes have made Republicans more willing to work with him.
The first part of his plan, “cuts to help America’s small businesses hire and grow”, had as its centerpiece cutting the payroll tax in half for 98 per cent of businesses. It also included a complete payroll tax holiday for added workers or increased wages.
The second part, “Putting workers back on the job while rebuilding and modernising America”, included a “Returning Heroes” hiring tax credit for veterans, proving anywhere from $5,600 to $9,600; support for state and local governments to prevent up to 280,000 teacher layoffs, while keeping cops and firefighters on the job; school modernisation for at least 35,000 public schools, supporting new science labs, internet-ready classrooms and other renovations; immediate investments in infrastructure and a National Infrastructure Bank to modernise roads, rail, airports and waterways and put hundreds of thousands of workers back to work; a new “Project Rebuild”, which will put people to work rehabilitating homes, businesses and communities, via various different public-private collaborations.
 |
| Obama’s plan cuts the payroll tax in half for 98 per cent of businesses [GALLO/GETTY] |
The third part, “Pathways back to work for Americans looking for jobs”, included extension of unemployment insurance for five million Americans with three “innovative reforms” supporting state-level programs, one to support work-sharing alternatives to layoffs; another for displaced workers to take temporary, voluntary work or pursue on-the-job training and a third to provide wage insurance to help reemploy older workers or help them start their own businesses. It also included a $4,000 employer tax credit for hiring the long-term unemployed, and a prohibition on discriminating against unemployed workers.
The fourth part, “Tax relief for every American worker and family”, included cutting payroll taxes in half for 160 million workers in 2012, providing a $1,500 tax cut to the typical American family; and allowing more Americans to refinance their mortgages at then-current interest rates, around 4 per cent.
This proposal represented a true “jobs plan” in a traditional sense. It had a detailed focus on specific aspects of the problem and specific policies to address those aspects. The relationship between problem and solution was transparent and straighforward, which also means that problems with the ideas proposed, as well as possible alternatives, could also be articulated with a good deal of specificity. This is inevitably less true with broader economic plans, which have multiple explicit short- and long-term goals, as well as cultural, social and political agendas as well. This could be seen if one were to consider Obama’s recently-released budget, for example, or even the more narrowly job-focused recent proposals of Obama’s jobs council of top US business leaders.
But it’s much more pronounced with the economic proposals of the remaining top two GOP candidates, Mitt Romney and Rick Santorum, which the second part of this article will address.
Paul Rosenberg is the Senior Editor of Random Lengths News, a bi-weekly alternative community newspaper.
You can follow Paul on Twitter: @PaulHRosenberg