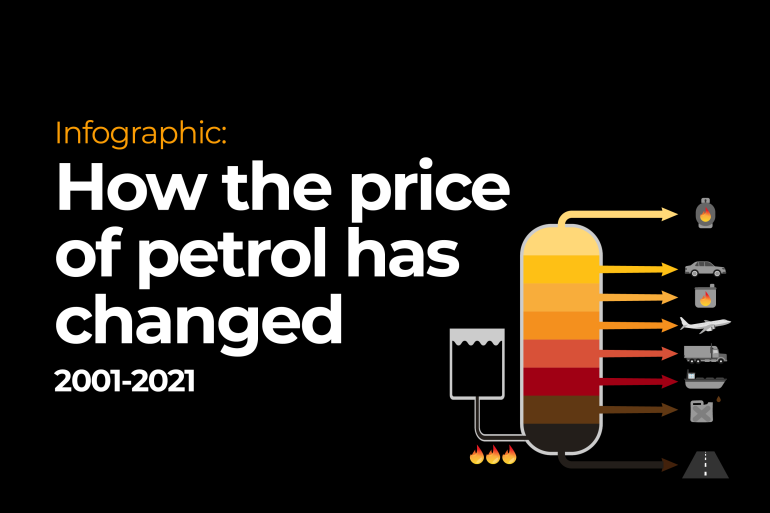
Infographic: How the price of petrol has changed (2001-2021)
The global average price of petrol has doubled over the past 20 years. Here are five graphics that explain the global oil and energy industry.
Published On 30 Sep 2021
Petrol prices are nearing all-time highs in many countries around the world as surging demand and supply shortages send global oil prices to a near three-year high.
In 2001, the global average price of petrol was about $0.60 a litre, and filling an average family sedan cost about $30. Today it is $1.20 – $30 will buy you half a tank.
Keep reading
list of 4 itemsEnergy crunch: Three more UK power firms collapse
OPEC says oil will remain number one, despite green energy push
Energy crunch: China mulls hiking power prices for factories
High fuel prices are part of a global energy crunch that has led to big disruptions across China, the United States, the United Kingdom and Europe. Petrol and diesel prices have also spiked in several countries including India and South Africa.
As of September 2021, Hong Kong has the most expensive petrol in the world at $2.56 per litre ($11.63 per gallon) followed by the Netherlands – $2.18 ($9.91 per gallon) and the Central African Republic – $2.14 ($9.72 per gallon). High taxes largely contribute to the high cost at the pump.
The countries with the cheapest petrol include mostly oil-rich countries including Venezuela at $0.02 ($0.09 per gallon), Iran – $0.06 ($0.27 per gallon) and Syria – $0.23 ($1.04 per gallon) according to globalpetrolprices.com.

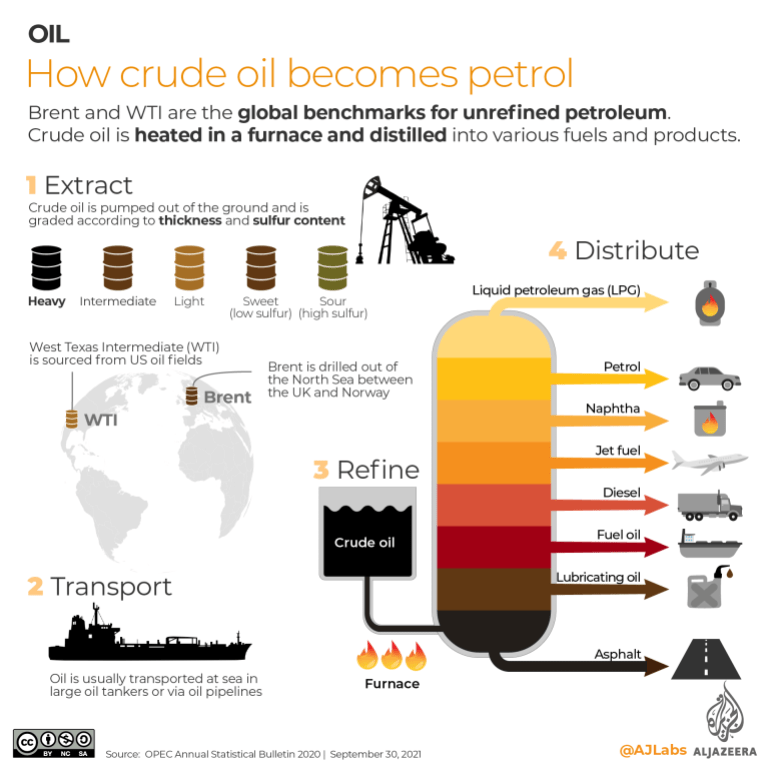
How crude oil becomes petrol
Petrol, diesel and various other fuels are made from crude oil – a yellowish-black fossil fuel that is pumped out of the ground. Many household products including plastics, detergents and clothing are also derived from the non-renewable resource.
Higher crude prices have a knock-on effect on several industries, from transport all the way through to manufacturing.
Crude oil is graded according to thickness (heavy, intermediate and light) and sulfur content (sweet – low sulfur, sour- high sulfur). Light, sweet crude oil is the highest grade. It is easier and cheaper to refine, making it the most sought after.
Brent and WTI are the global benchmarks for light, sweet crude oil. Brent is drilled out of the North Sea between the UK and Norway while WTI (West Texas Intermediate) is sourced from US oil fields.
Once the oil has been extracted and transported to various oil refineries, it must be heated in a furnace then distilled into various fuels and products. Lighter products including liquid petroleum gases require lower temperatures to extract while the heaviest products including asphalt are extracted at much higher temperatures.
How the price of petrol has changed (2001-2021)
The price of petrol at the pump depends on various factors, including the price of crude oil, transport costs, state taxes and distribution costs.
In 2001, Brent crude was trading for about $25 a barrel. One barrel is equivalent to 42 gallons or approximately 159 litres.
At its peak in 2008, Brent cost some $140 a barrel before crashing down to $45 after the global financial crisis, which destroyed demand for energy.
In April 2020, the price of oil once again plummeted to record lows as the COVID pandemic swept the globe, prompting nationwide lockdowns and very weak demand.
By September 2021, surging demand coupled with supply shortages has sent crude prices to a near three-year high at approximately $80 per barrel. Analysts at Goldman Sachs expect Brent crude to hit $90 a barrel by the end of the year.

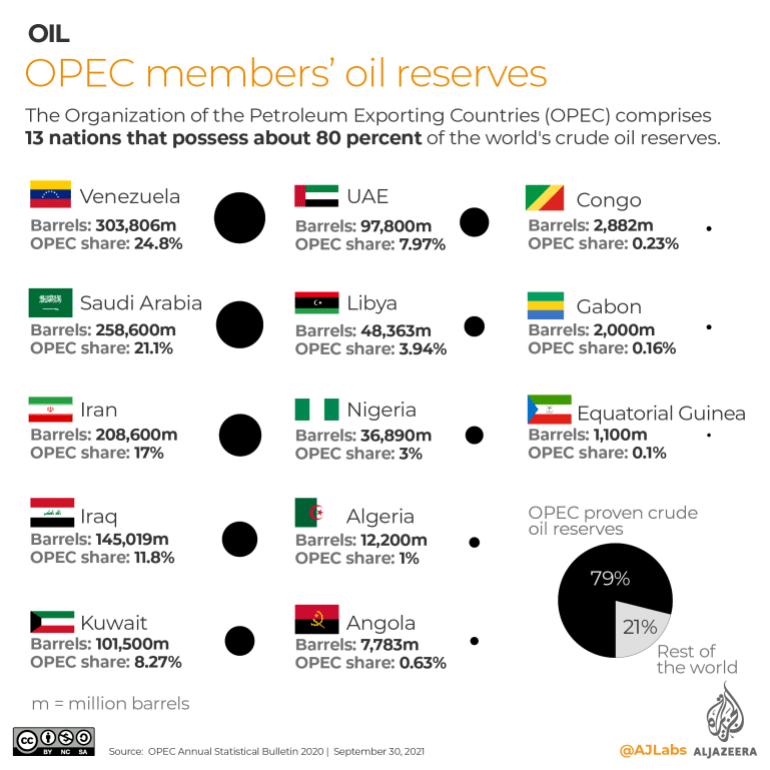
OPEC members’ oil reserves
Central to the world’s oil production is OPEC – the Organization of the Petroleum Exporting Countries. Established in Baghdad, Iraq in 1960, this multinational organisation comprises 13 nations that collectively possess about 80 percent of the world’s proven crude oil reserves.
OPEC member countries produce about 40 percent of the world’s crude oil and represent some 60 percent of the total petroleum traded internationally, according to the United States Energy Information Administration.
OPEC sees oil demand returning to pre-pandemic levels in 2022 and expects output to grow by 1.7 million barrels per day in 2023.
Venezuela has the world’s largest proven oil reserves at 303,806 million barrels followed by Saudi Arabia with 258,600 million and Iran with 208,600 million according to OPEC’s 2020 annual statistical bulletin.
Which countries have the most oil?
Venezuela, Saudi Arabia and Iran have half of the world’s 1.55 trillion barrels of proven oil reserves. The largest reserves among non-OPEC countries include Russia (80,000 million barrels) and the US (52,637 million barrels).
In 2019, the world consumed 99.7 million barrels of oil per day (mbpd) according to the International Energy Agency. The US alone consumes about one-fifth (20.48 mbpd) of the world’s daily oil consumption followed by China (13.07 mbpd) and India (4.84 mbpd).
According to OPEC’s Secretary-General Mohammad Barkindo, oil will retain its number one position in the global energy mix, providing 28 percent of global energy needs by 2045.

Source: Al Jazeera