Gold prices are slumping – could they fall further?

Published On 23 Sep 2020
Gold’s slump this week is forcing investors to ask whether the haven asset is taking a breather or facing an even sharper decline.
Unprecedented global stimulus, negative real rates and a weakening dollar pushed bullion to a record high above $2,075 an ounce in early August. While some banks, including Goldman Sachs Group Inc. and Bank of America Corp., forecast even higher prices, a resurgent dollar has seen gold give up some of its gains.
Keep reading
list of 4 itemsWhy is Japan’s yen falling and why is it so weak against the US dollar?
ByteDance prefers TikTok shutdown in US over sale: Report
Stocks slide on Middle East tensions as hope crisis contained stems losses
Is this merely a temporary setback for the precious metal? Here are five charts that provide hints as to where gold goes next:
Dollar Dominance
The key driver of gold right now is the dollar. This week the U.S. currency strengthened, even as the Federal Reserve remained ultra dovish on interest rates. The dollar’s newfound vigor is linked to fading hopes of more stimulus from the U.S. That’s depressed gold, even as Covid-19 infections spike across Europe and fatalities exceed 200,000 in the U.S.
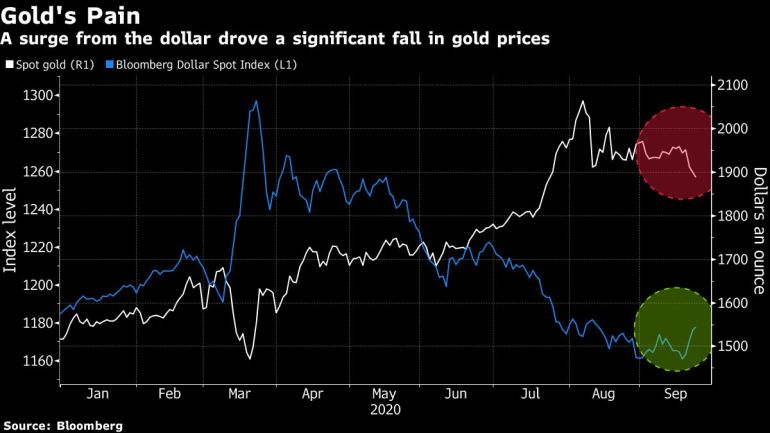
“The firm U.S. dollar is like a millstone around the neck of precious metals prices, and is putting pressure on gold despite increased risk aversion,” Carsten Fritsch, an analyst at Commerzbank AG, wrote in a note. Still, Fed policy will remain expansionary for years, so “the strength of the dollar is hardly likely to last,” he said.
Plateauing Rates
Gold’s investment appeal over the summer was burnished as real treasury rates slid deeper into negative territory. Since early August, those rates have been flat, and it will take a significant boost to inflation expectations to drive them lower.

Breakevens — measures that draw on pricing of nominal and inflation-linked Treasury debt to create a proxy for price gains — have been declining since August. With the global economic recovery stuttering as the virus flares, inflation is unlikely to be uppermost in the minds of investors, according to Ole Hansen, head of commodity strategy at Saxo Bank A/S.
Key Milestones
Gold’s decline this week gathered momentum after it slipped below its 50-day moving average, which technical traders can take as a signal to sell. The metal’s next key threshold — the 100-day moving average — should provide some resistance to falling prices. However, a drop below that level could trigger further selling.

ETF Watchers
Investors’ favorite way of buying gold this year has been through exchange-traded funds, which have added 870 tons of bullion. After gold slipped on Monday, ETFs saw their largest inflows in at least a year as investors bought the dip. However, a second day of price declines didn’t spark the same appetite, with some selling of bullion-backed funds, according to preliminary data compiled by Bloomberg.
“ETFs increased in recent days and now they pause to see what will happen,” said Georgette Boele, a precious metals strategist at ABN Amro Bank NV. “If weakness continues, they will sell quickly again.”

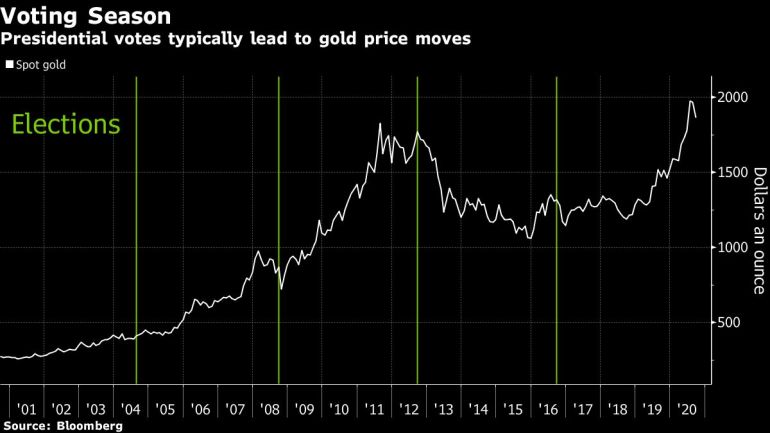
Volatile Election
Over the past 20 years, gold has tended to move both in the lead up to and aftermath of U.S. presidential elections as investors weigh the potential impact on the dollar, treasury yields and global political risk. November’s election will potentially be the most fraught in decades, fomenting uncertainty that gold will surely enjoy.
Source: Bloomberg