La Nina explained
La Nina can cause devastation around the world, but what is it?

Published On 24 Jun 2012
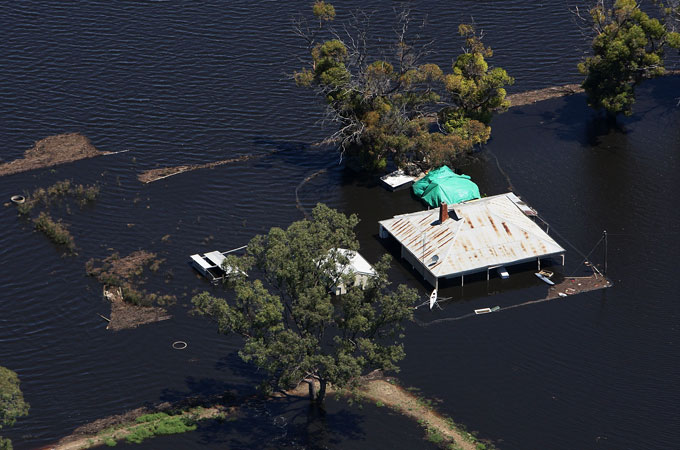 |
| La Nina triggered some of the worst weather disasters in 2010 – 2011, including the flooding in Australia. [Gallo/Getty] |
La Nina is the name given to the slight cooling of the surface waters of the Pacific Ocean. As the ocean is one of the biggest influences on our weather, this change in the surface temperature has a dramatic effect on the weather around the world.
The exact causes of La Nina are still being studied, but what is known is that during a La Nina event the prevailing winds strengthen. These winds blow towards the west, so the warm surface waters are blown away from the coast of South America, towards Indonesia. This causes cold waters from the depth of the ocean to well-up along the coast of Peru and Ecuador.
Keep reading
list of 4 itemsTurtles swimming to extinction in Malaysia as male hatchlings feel heat
Could shipping containers be the answer to Ghana’s housing crisis?
Thousands protest against over-tourism in Spain’s Canary Islands
La Nina has some affects that are fairly instinctive and easy to explain; for example, as the water near the coast of Peru and Ecuador is cooler than usual, it makes sense that the weather in the region is also cooler than usual. It is also fairly intuitive that if the waters around Indonesia are warmer than usual, then this part of the world will be wetter than usual, as the warmer water will heat the air, and warmer air can hold more moisture than cooler air.
However, there are far more wider-reaching impacts of La Nina that are not at all instinctive and affect the weather across many parts of the globe. For example, a La Nina episode usually increases hurricane activity in the Atlantic.
The strength of the La Nina conditions and its impacts on the weather can vary dramatically, but this image from the Climate Prediction Centre, part of the National Oceanic and Atmospheric Administration (NOAA), gives an indication of some of the most common effects of La Nina.
 |
| Some of the most common weather anomolies caused by La Nina [NOAA] |
La Nina conditions have been reported in the following years: 1904, 1908, 1910, 1916, 1924, 1928, 1938, 1950, 1955, 1964, 1970, 1973, 1975, 1988, 1995 and 1998. However, the conditions can remain with us for more than one year; the La Nina event which started in 1998, actually remained in place until 2000.
In June 2010, NOAA reported that La Nina conditions had begun again. Detailed records of the intensity of different La Nina events only go back about 50 years, but this La Nina turned out to be one of the most intense ever recorded.
The weather patterns across the world were almost straight out of the La Nina text book. Almost all of the impacts expected by National Oceanic and Atmospheric Administration materialised.
During La Nina, it’s not the whole of the Pacific Ocean which is cooler than normal.
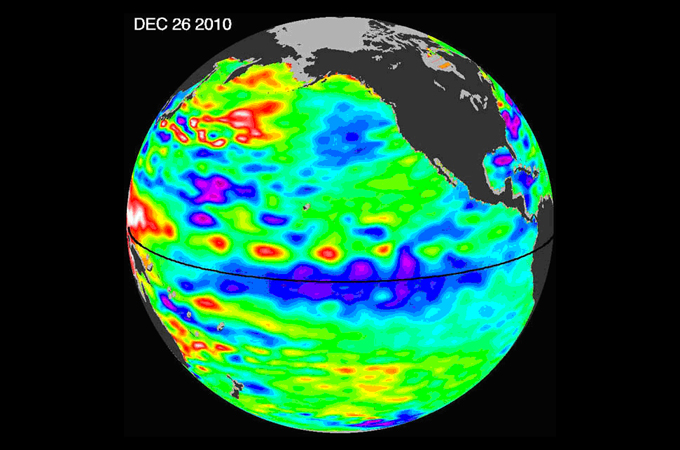 |
| The line of blues and purples stretching across the equator is the signature of a classic La Nina. [NASA] |
This NASA image of the Pacific Ocean shows how the temperature of the surface water differs from average. You can clearly see the thin line of blues and purples stretching across the equator. This is the image of a classic La Nina conditions, which were recorded in December 2010.
La Nina and El Nino conditions are detected by looking at data from various sources, including satellites and buoys. However, it’s very difficult to forecast the conditions of the ocean more than three months in advance.
Obviously with impacts on such an enormous scale, improved forecasts of these episodes would be invaluable. Countries would be able to prepare for flooding or droughts and this could undoubtedly save lives.
Source: Al Jazeera